
Analytics
Analytics gives you a live view of how your students and quizzes are performing — no spreadsheets needed.
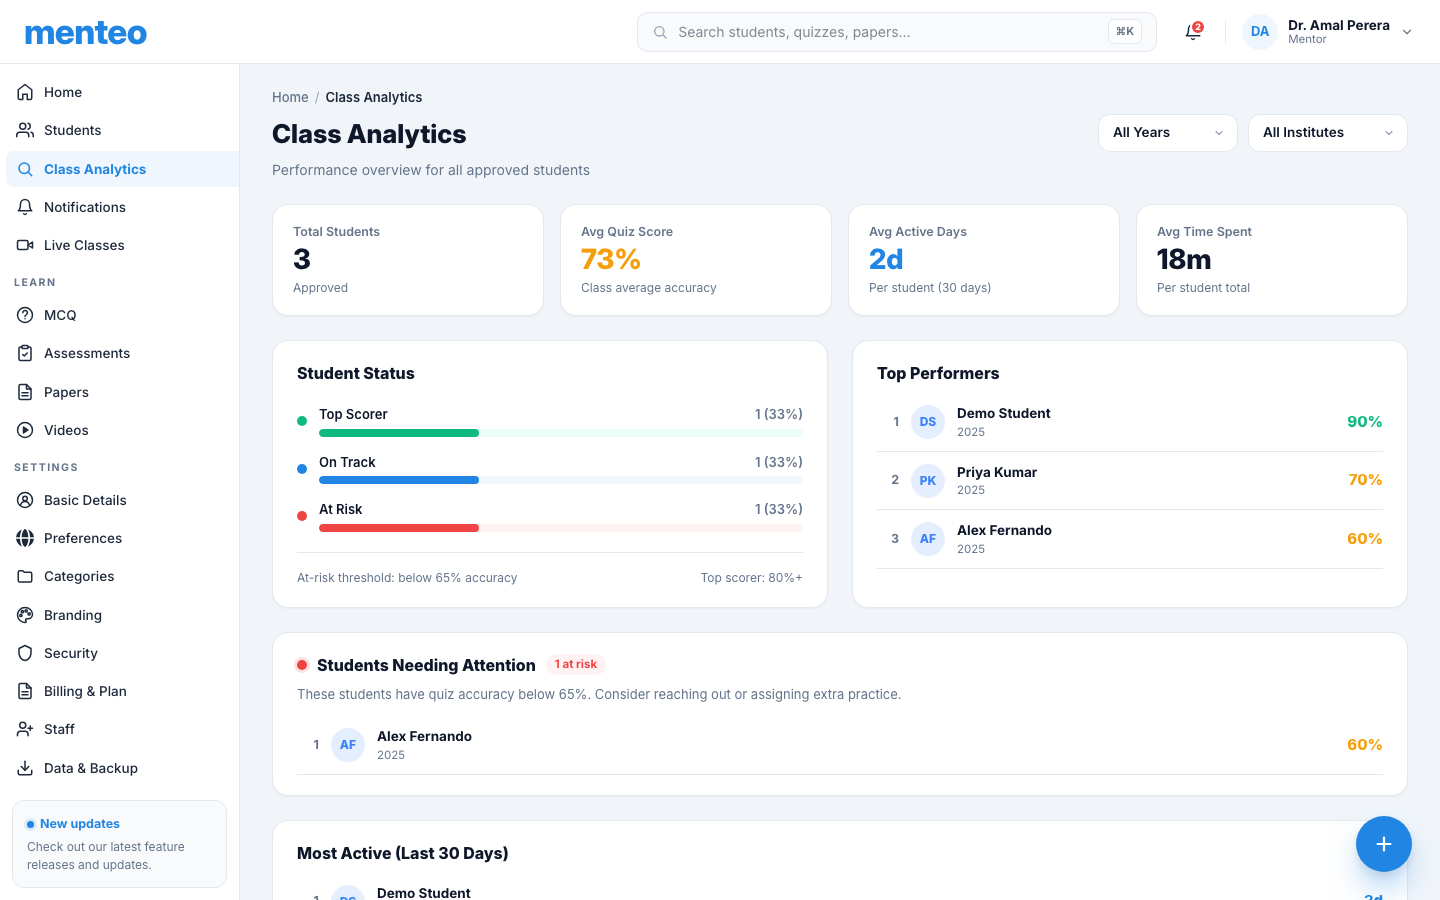
There are two analytics views: Class Analytics (all students) and Quiz Analytics (per quiz).
Class Analytics
Click Analytics in the sidebar to open the class-level dashboard.
Summary Stats
Four KPI cards appear at the top:
| Card | What it shows |
|---|---|
| Top Scorers | Students with 80%+ average accuracy |
| On Track | Students with 65–79% accuracy — performing solidly |
| At Risk | Students below 65% — may need extra attention |
| Total Students | Count of all students matching current filters |
Below the cards you see three averages across your filtered group:
- Avg Practice — average accuracy % across all quiz attempts
- Avg Streak — average consecutive-day login streak
- Avg Time — average minutes spent in the platform
Filters
Use the Academic Year and Institute dropdowns to narrow the view to a specific cohort. The KPI cards and averages update instantly.
Top Performers
A ranked list of your top 5 students by accuracy, with their practice percentage and streak shown inline.
Students Needing Support
The At Risk panel lists students below the 65% threshold, sorted by lowest accuracy first — the ones most likely to benefit from a message or extra practice material.
Streak Leaderboard
Shows students ranked by their login streak (consecutive days active). A long streak indicates consistent engagement even if scores are not yet high.
TIP
Click any student's name in the Analytics view to jump directly to their individual profile — where you can see every quiz attempt and assessment submission.
Quiz Analytics
Every quiz has its own analytics page. To open it:
- Click Quizzes in the sidebar
- Click a quiz title
- Click the Analytics tab
KPI Cards
| Card | What it shows |
|---|---|
| Attempts | Total number of submissions across all students |
| Avg Score | Average percentage score across all attempts |
| Accuracy | Average fraction of questions answered correctly |
| Avg Time | Mean time taken to complete the quiz |
Score Distribution
A bar chart grouping attempts into five score bands: 0–20%, 20–40%, 40–60%, 60–80%, 80–100%. Use this to see whether the quiz is too hard, too easy, or well-calibrated.
Per-Question Accuracy
A horizontal bar for each question showing the percentage of students who answered it correctly. Questions with low accuracy are candidates for review — either the question is ambiguous or the topic needs re-teaching.
TIP
Click a low-accuracy question row to expand it and see the answer distribution — which wrong option students most commonly chose.
Student Breakdown
A table showing every student's result:
| Column | Description |
|---|---|
| Student | Name and avatar |
| Score | Raw score / total marks |
| % | Percentage, colour-coded green/amber/red |
| Time | Time taken to complete |
| Attempt | Which attempt number this was |
Click a student's row to see their answer-by-answer breakdown for that attempt.
FAQ
Why is a student showing 0% accuracy? They may have submitted without answering all questions, or answered every question incorrectly. Check the per-attempt detail to confirm.
Can I export the analytics data? Yes — go to Settings → Data & Backup and export your full academy data as JSON. The export includes all quiz attempt records.
How is "At Risk" defined? Below 65% average accuracy across all quiz attempts. This threshold is fixed and applies to the selected filter group.
Does analytics include assessment (PDF) grades? Not yet — the analytics views cover quiz attempts only. Assessment grades appear on each student's individual profile.